Incident Reporting in Hospitals
In the healthcare industry, incident reporting is an important task that records all the unusual events occurring at hospitals, nursing homes, and other medical facilities. An incident report is a formal report written by practitioners, nurses, or other staff members to inform facility administrators of incidents that allow the risk management team to consider changes that might prevent similar incidents. The forms used for incident reports are either paper forms or electronic.
Despite all the advances in medical technologies, Incident management remains a paper-based manual process in many hospitals. We understand that multiple factors drive these decisions. We talk about the effects of a paper-based vs a digital system on the incident reporting process here.
The first knock of a transition from paper medical records to electronic come after the American Recovery and Reinvestment Act (ARRA) 2009. This law encouraged healthcare providers in the United States to digitize internal record systems and develop a centralized database so that doctors, physicians, and nurses can easily access health records.
However, moving from a paper-based system to a paperless one isn’t that simple and easy. That’s why many healthcare facilities haven’t gone completely paperless even after a decade of modern record system. They might be trying to avoid a few hurdles, but in reality, they are facing multiple challenges daily with the paper-based method, such as:
- Time-consuming
- Ineffective Data Presentation
- Not scalable
- Limited security
- Missing Audit trail and tracing
- Prone to error
- Difficult to analyze
Therefore, healthcare facilities required fast, secure, and quick incident reporting. In short, they need an automated incident reporting system. But, as of now, only two-thirds of hospitals have focused on automation.
Create-Track-Monitor Incidents using Excel
We have been working with healthcare facilities for years now, so we duly understand that automation isn’t an easy task. It is an expensive and technical process that not all hospitals can adopt.
We are here to help you with an alternative, that won’t cost you a dime. A free, reliable, and effective incident management system for medical facilities— Excel reporting.
For hospitals that are not yet ready to dive into healthcare incident reporting software, using Excel is an inexpensive and reliable option, as it can quickly get you off the ground. In this article, we’ll discuss how you can use Excel to maintain and track your incidents.
To manage all incidents in one place, and analyze them effectively, the quality manager needs to organize different sets of data to draw conclusive statistics. However, when incidents are recorded in papers, analyzing the data or locating patterns is a daunting task. Thus, a need for meaningful data emerges where data is easily readable and interpretable.
For Example—
In a paper-based reporting, an incident description will be recorded like this:
“A Patient A was sleeping on his bed in Ward No. 2. While turning in his sleep, he fell from the bed. The attending nurse immediately rushed to him and helped him get back onto the bed and put the bed rails up. The patient did not sustain any injuries.”
Now, if same information is captured in structured format, it will look like this:
Incident Type: Patient fall
Incident Subtype: Fell from bed
Incident Location: Ward 2
Affected People: Patient A
Injury: None
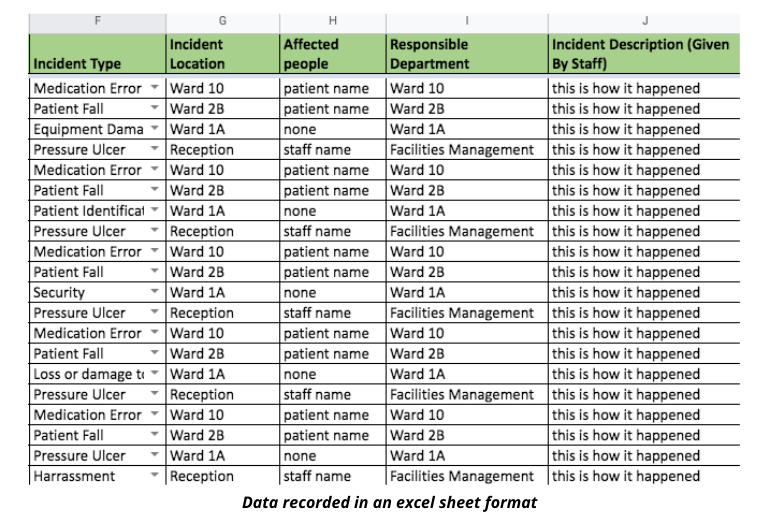
It is evident that the data recorded in the second style is easier to navigate, analyze and interpret. Therefore, the way you record data makes a huge difference in the analytical process.
If you are using paper forms for reporting and managing incidents, we have even eased your work by creating an Incident Report Excel Template along with a process to custom create incident reports in Excel.
Download Free Incident Report Excel Template ⬇️
How to structure your data
When you want to gain insightful information from an incident report, you have to record every minute detail in it. However, the amount of report details depends upon your organization’s size, patient safety goals, claim frequency, and other relevant factors. In a hospital incident report, it is essential to add the following details:
Incident occurrence date
The well-informed incident report needs basic information such as the date and time of the incident. This is one of the most important pieces of information especially useful to calculate statistics and performance.
Location of the Incident
Specifically, mention the location of the incident along with the particular area within the hospital—for example, patient X fall in Ward no. 2 near the bed. When you use Excel, it is a good idea to make the Location field into a dropdown field. Generate a list of all possible locations, from the lift lobby to OT, and select from the values, rather than typing it as text. This helps you to convert ‘Location’ into a measurable field and you can generate statistics out of it, such as, “What is the most prone location for a fall?”.
Type of the Incident
This is the key information that will help you in analyzing and processing your data, as well as generating your statistics for the management. You can categorize the incidents as Medication Error, Patient Fall, Equipment Damage, Patient Identification, etc. When you use Excel, it is a good idea to make the Incident type field into a dropdown field. Create a list of all the incident types you want to capture and select from the values, rather than typing it as text. This helps you to convert ‘Incident Type’ into a measurable field and you can generate statistics, such as, “What is the most common incident in my hospital last year?”.
Parties Involved in the Incident
The name and contact details of all the parties involved in the incident to follow up. If there are witnesses available to the incident, it will be helpful to add their statements in your report. While writing witness statements, focus on the following attributes—specific details provided related to the incident, use quotation marks to frame their statements, note witnesses’ location at the time of the incident, and how they are related to the incident.
Detailed Incident Description
The incident description is provided by the person who reported the incident. This can be as detailed as it can get, as more the information in hand, the better it is to investigate it further.
Comments
Once you have all the information from the reporter, you can track the incident in excel by recording all the follow-up discussions, comments given by Supervisor or other managers all in one single row in excel!
Risk Assessment Score
Whether you use a 5×5 Risk matrix or a SAC scoring of 1 to 4, you can enter the severity risk score against the incident, again in the same row!
Contributing Factors
Except for minor incidents, everything else will most likely go through a root cause analysis and investigation process. It is a good practice to maintain a list of all the Contributing factors, (either London Protocol or you can follow your hospital guidelines) and select from the values, rather than typing it as text. This helps you to convert ‘Contributing factors’ into a measurable field and you can generate useful statistics, such as, “What is the top contributing factor for my incidents?”.
What is Meaningful Data?
Meaningful data is, in simple terms, usable statistics and actionable insights that can be used to evaluate the efficiency and effectiveness of your process. The meaningful data answers numerous aggregated questions, provide you useful insights without many efforts
- How many fall incidents happened last month?
- How many medication errors occurred last year?
- What percentage of incidents are still open?
- What is the most common occurrence?
- Which location is prone to more falls?
As we have cleared in the above example that paper-based recorded data can’t help you find aggregated results without spending hours or days of effort. But, with excel, you can utilize the features such as a drop-down list and data filters to derive this meaningful information quickly.
Download our ready-to-use Incident Report Excel Template
If you don’t know how to turn a vanilla Excel spreadsheet into an incident report sheet, do not fret! Download our ready-to-use Incident Manager Template. The template contains all the information that you minimally need to capture and provides some incidents for reference. You can customize the template to suit your needs, especially the parent list of incident types, list of departments, and statuses. In the following sections, we also explain how you can do this.
However, if you want to build your own custom incident manager spreadsheet from scratch, read more as we walk you through the process.
Customize your Incident Report Tracker Excel Template
How to Create a Drop-down for Columns?
Drop-down is a very useful Excel feature where you can sort relevant information based on your requirements. For instance, using our template you can easily sort information based on incident type and contributing factors. However, to create a custom drop-down list, you can follow these steps:
- Select the cells that you want to contain the lists.
- On the ribbon, click DATA > Data Validation.
- In the dialog, set Allow to List.
- Click in Source, type the text or numbers (separated by commas, for a comma-delimited list) that you want in your drop-down list, and click OK.
Here is a video explaining this step by step.
How to Use Filter Function?
The filter function allows users to easily extract matching records from a larger set of data based on certain criteria. Suppose you want to know how many open incident cases were present in Ward No. 2, our incident template will immediately show you—just follow these instructions:
- Select any cell within the range.
- Click on Data > Filter.
- Next, select the column header arrow.
- Now, you can choose between Text Filters or Number Filters.
For eg. To know the number of open incidents, you should select the Status field and select ‘Open’ (unselect ‘Closed’). To know the number of such open incidents in Ward 2, you should select the Location field and select ‘Ward 2’. Now you have the narrowed down list of Open incidents from Ward2.
How to Create a PivotTable?
In Excel, you can use PivotTable to calculate, summarise and analyze data present in your report. Additionally, you can easily compare and find trends in your data. With our template, you can create Statistics on Incident Types or by departments or by status.
PivotTable works a little different depending on what platform you are using to run Excel, but the simple way to create PivotTable is:
- Select a cell where you want to create PivotTable.
- Select Insert > PivotTable.
- Under Choose the data that you want to analyze, you can Select a table or range.
- Verify the cell range in Table/Range.
- Under Choose where you want the PivotTable report to be placed, you can select a new worksheet or an existing one to add PivotTable and select OK.
- You can add fields to your PivotTable, click on the field name checkbox in the PivotTables Fields pane.
How to Refresh PivotTable?
When you add new information to our pre-made worksheet, you need to refresh the PivotTable to provide updated statistics to you. To refresh PivotTable:
- Click anywhere on the PivotTable to appear the PivotTable Tools ribbon.
- Select Analyze > Options.
- Go to the Data tab, check the Refresh data when opening the file box.
How to Create Graphs?
To better analyze incident data, you can convert it into a graph and chart with our template. The graph can be created in Excel as:
- Select a cell.
- Choose a graph from the nine graph and chart options.
- Highlight your data and click on ‘Insert.’
- Adjust data’s layout and colors.
- As per your requirements, change the size of the graph and axis labels.
Here is a video that explains this step-by-step
Download template
Get started today by downloading this Incident Report Template we created for you to easily start managing your incidents. The template contains all the minimal information that you need to capture. You can customize this template to suit your needs, especially customizing the parent list of incident types, contributing factors, list of locations, and departments.
QUASR Lite
QUASR Lite is the simplest online incident reporting system for hospitals you have been looking for. The main advantage QUASR Lite brings to you over vanilla excel sheets is that: we have built it specifically for hospital incident scenarios. We consolidated our experience working with many hospitals and created a starter tool that will grow with you as you mature into bigger and more involved processes. You’ll be able to attach evidence, share reports with selected staff or departments and notify senior management of serious incidents. Since it is digital, you can effortlessly search, sort, or churn statistics for those important management meetings.
QUASR Lite is aimed at organizations that are just getting started or wanting to digitize their incident management process. Whether you have a simple paper-form method or looking to create your own structure and process, QUASR Lite has you covered.
Check out more features of QUASR Lite. You can sign up for a 14-day free trial here.